Ishikawa Diagram
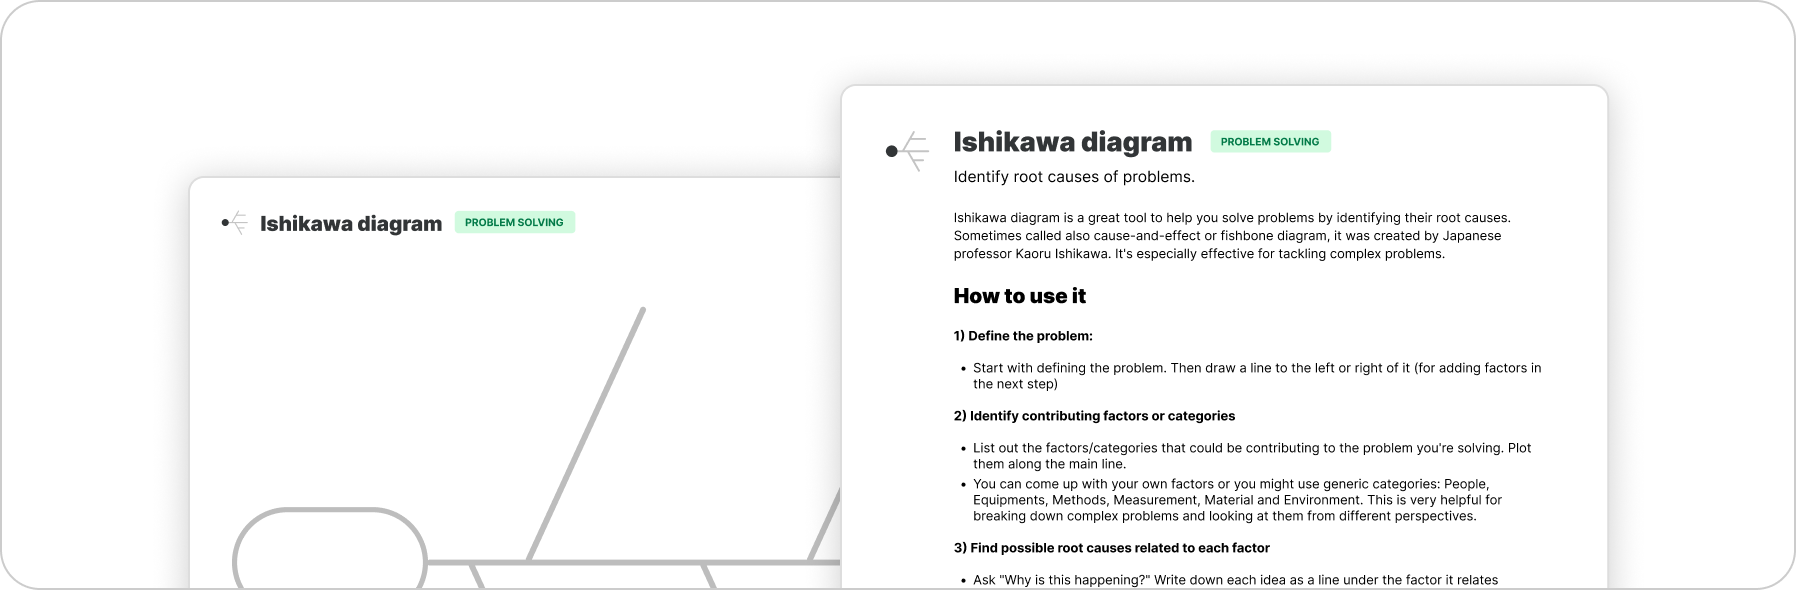
PROBLEM SOLVINGIshikawa diagram is a great tool to help you solve problems by identifying their root causes. Sometimes called also cause-and-effect or fishbone diagram, it was created by Japanese professor Kaoru Ishikawa. It's especially effective for tackling complex problems.
How to use it
Building out this diagram consists of few simple steps. This can be done in a group as a workshop but also just as well on your own.
1) Define the problem
Start with defining the problem and then drawing a line to the left or right of it (that's up to your preference).
The line will be for adding factors in the next step.
2) Identify contributing factors or categories
List out the factors/categories that could be contributing to the problem you're solving. Plot them along the main line.
You can come up with your own factors or you might use generic categories: People, Equipments, Methods, Measurement, Material and Environment.
Categorising is very helpful for breaking down complex problems and looking at them from different perspectives.
3) Find possible root causes related to each factor
Ask "Why is this happening?" Write down each idea as a line under the factor it relates to. First principles thinking is useful here including the "Five whys" method.
Keep in mind that the problem might not have just one root cause but multiple. So it's important to capture everything that might explain the problem, even if just partially.
At this point, you should have a complete diagram but no definitive answer yet.
4) Analyse the diagram
The most important step is looking at all the possible root causes and analysing them. The diagram now provides a structure for your most important thinking and next steps.
There are many possibilities what you can do at this point. Perhaps you can gather more data/evidence for each root cause candidate or immediately identify the most likely one and quickly try to solve it. This will depend on your specific problems and identified possible causes.
Example
Now let's see how to apply this on a practical example.
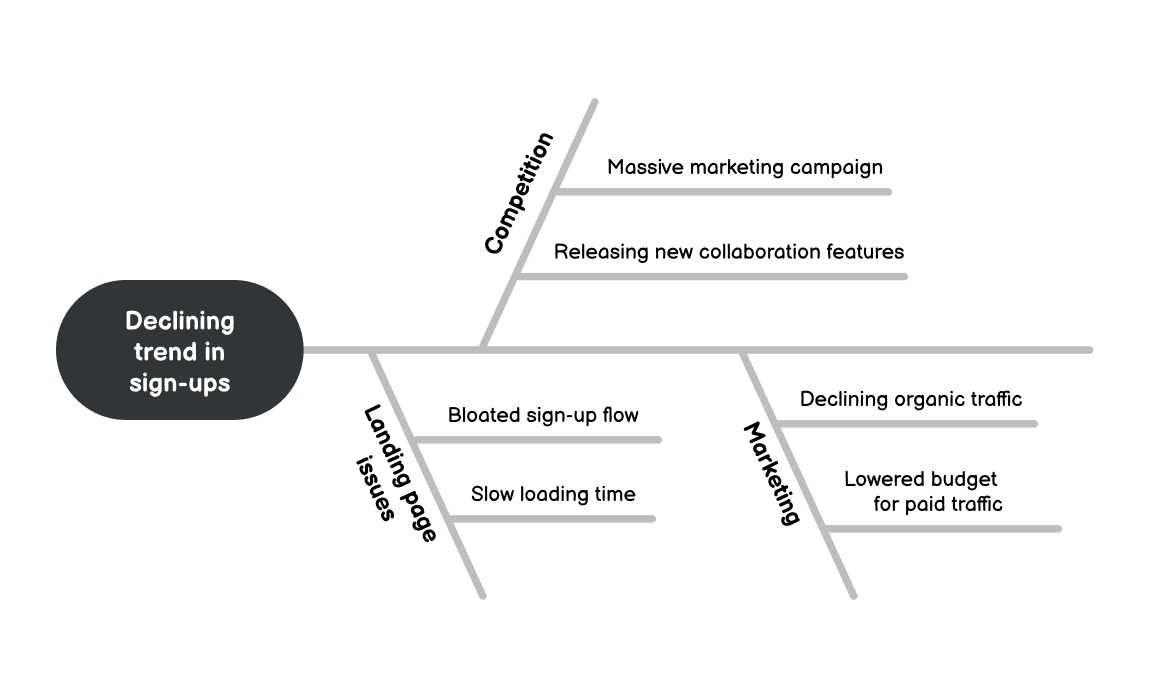
Suppose you're a product manager and have to solve a trend of getting less and less new sign-ups. You start with this definition and then identify contributing factors.
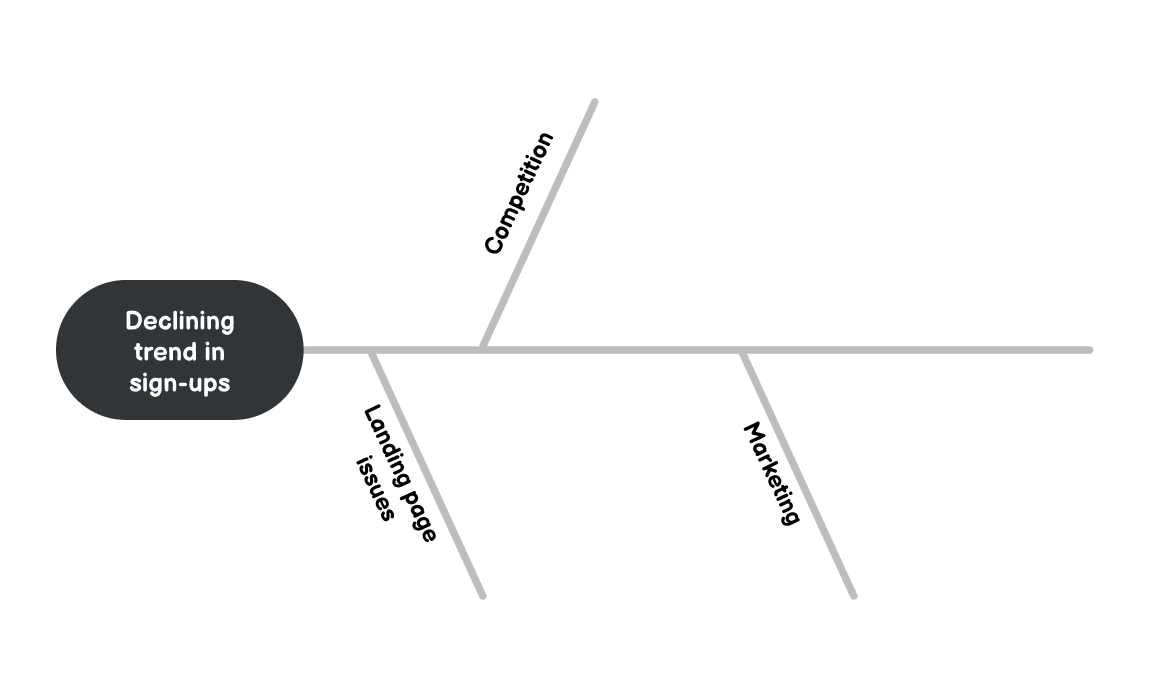
In this example, you identified landing page issues, competition and marketing as factors.
Now let's find specific possible root causes under each factor:
With all of these written down, you can begin to analyse where the problem originates. In this example, you might first verify if the conversion rate is steady despite lower traffic. Then you might audit your sign-up flow to find any leaks and possibly streamline it.
This is a simplified example but this diagram can be definitely used for much more complex problems.
Put Ishikawa diagram to practice
I've created a template (in PDF and Miro) for creating your own Ishikawa diagram. It includes a step-by-step guide with examples.
You can get it with Untools Vault which gives you instant access to all Untools premium templates and monthly exclusive deep-dives about thinking tools.
Takeaway
Ishikawa diagram offers a simple framework for finding root causes of problems:
- Define the problem
- Identify contributing factors or categories
- Find possible root causes related to each factor
- Analyse the diagram
You'll create the diagram with the first three steps. It will then provide a structure for your analysis.